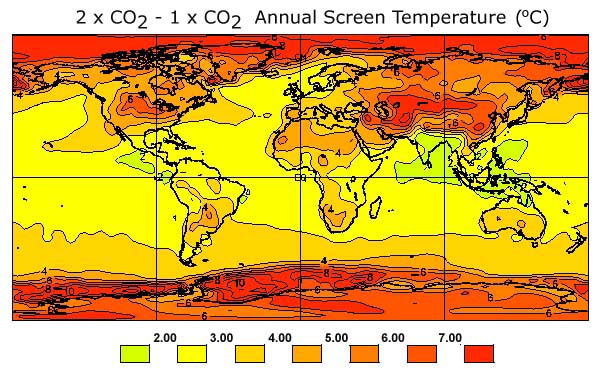
Projections of global warming due to increased CO2 show greatest warming in the Arctic and Antarctic.
This figure shows possible increase of surface temperature if CO2 doubles.
Enhanced warming at high latitudes is partly due to sea ice retreat. As warming melts ice, less ice allows more sunlight to be absorbed, causing more warming. Less sea ice also exposes the polar winter atmosphere to warmth from the underlying ocean.
Because the warming "signal" should be clearest in the Arctic, scientists watch the Arctic for early signs of global change. Less Arctic ice would also have profound local consequences, threatening the survival of polar bears and opening a Northwest Passage to shipping -- among other things.
Do we actually see a melting Arctic? In some ways, yes. Permafrost is melting in Alaska and in Siberia. Northern residents provide anecdotal corroboration, sometimes sighting unusual fish, birds and insects.
But is the main Arctic sea ice pack melting? Historical data (whaling and sealing logs) indicate wide swings between times of more ice and less ice. With the advent of satellites, we can be more precise for the period 1978 to present. During this period the area covered by Arctic sea ice appears to be shrinking at a rate of about 3% per decade.

While these satellite products show the ice-covered area shrinking (albeit not at an alarming rate), what is happening to thickness of the ice? Thickness is much harder to measure over the expanse of the Arctic Ocean. Some information about thickness can be obtained from nuclear submarines which use upward sonar to measure ice draft. During the 1990's the US Navy provided submarines for scientific study of the Arctic. Results from cruises in the 1990's can be compared with declassified data from military missions from 1958 through the 1970's.

Tracks in blue are from 1990's scientific cruises. Tracks in red are from earlier military missions. Because the submarines were not at the same locations, and the cruises were at different times of year (all late summer, early fall), comparisons are not exact. Details of processing are given by Rothrock, Yu and Maykut, Geophys. Res. Lttr., Dec. 1999.
Despite uncertainites about locations and timing, overall a stunning result emerged. Averaged over 29 widely scattered locations, ice thinned more than 40% in barely three decades. Amounts of thinning differed in different regions, but an overall thinning pattern was clear.

At this rate the Arctic would soon melt entirely! Is this an early sign of impending global warming? Is the loss of ice due to more melting (and less freezing)? Or did changes in wind patterns blow more ice from the Arctic out to the North Atlantic? Or did Mother Nature fool us in another way?
As we attempt to understand the Arctic, do we understand natural laws well enough to put together (and test!) ideas? Part of this effort involves computer models in which we represent flows within the Arctic ocean along with sea ice and snow on top.
Question: Applying estimates of atmospheric forcing, can we understand a 40% loss of Arctic sea ice?
Answer: no.
Neither changes to melting and freezing, nor to ice blown out of the Arctic, give 40% loss. We estimate losses by less than half that.
What is wrong?
1. We don't understand complicated situations involving sea ice and snow and their interactions with the underlying ocean and overlying atmosphere?
2. Computer models are limited in how to express natural laws?
3. Estimates of atmospheric forcing (wind, temperature, snow, radiation, ...) are wrong?
4. Mother Nature fooled us some other way?

Differences in ice thickness are shown throughout the Arctic as well as at the 29 submarine stations.
Averaged over the 29 stations, loss of ice volume is near 45% -- agreeing with the submarine study. Averaged over the entire Arctic Ocean, loss is about 12%. Most of the change was not from more melting / less freezing, and not from ice blown out to the Atlantic. Most ice remained in the Arctic, simply shifted more to Canadian waters outside the boundaries for submarine surveys (dodging draft-seeking US subs?)
An important caution must be read here. Scientific uncertainty
is a core concern in scientific analysis. While the above-cited 12% is a numerical
value produced by a computer, it depends upon many uncertain factors, ranging
from how well we (humankind) understand physics of ice-ocean systems, to how
well computers can express that understanding to how well we may estimate historic
wind and other patterns believed to force the ice-ocean system. Simply, we (humankind)
do our best to make likely inferences in the face of uncertainty. That is why
it is important that any reader of this web page not lift a number like 12%
our of context. A strong caution should be attached and/or the complete analysis
should be read in J. Climate, vol. 15, pg. 1691-1701 (2002).
What happened? Wind patterns are always changing. Usually winds over the Arctic swirl in a clockwise pattern. During the later period (1990s) the clockwise patterns was a little weaker than normal. For several months prior to the times of submarine cruises (near September) we have examined the patterns of windstress (the force wind exerts on the ice). Averaged over the latter three cruises relative to the earlier five cruises, the difference windstress pattern swirls counterclockwise.

Ice tends to move a little to the right of the windstress. The difference of ice thickness (1993,96,97 less 1958,60,62,70,76) followed the windstress swirl while moving radially outward, thinning the ice that remained in the central Arctic while compacting ice off the Canadian coast. This is why submarine surveys mainly in the central Arctic in the 1990s did not find the ice.
It seems we understand the submarine results, and it seems that overall Arctic ice did not thin by 40%. We estimate that the actual reduction of Arctic ice was about 12%. Given statistical fluctuations, this is consistent with area reduction of 3% per decade observed from satellites.
Of the 12% ice volume lost, we estimate that about 9% was blown out into the Atlantic and only about 3% of the loss represents less freezing and/or more melting.
A caution must be included. Despite careful effort -- ongoing effort! -- to understand the many aspects of sea ice interaction with its environment, and despite efforts to estimate the detailed history of atmospheric forcing, there is very much that is not understood and not known and not adequately represented in computer models. Our projections from models are "best guesses" given present knowledge. In their details, the projections are surely mistaken. The pattern of thinning agrees with the submarine data only grossly but not in detail. We feel confident to say
A more thorough article on this subject, including other sources of data and further computer analyses appeared in the Journal of Climate in 2002. A PDF file from the article can be viewed by clicking here. Figures in the article can be opened by clicking the following links:Dysfonction érectile. Figures in the article can be opened by clicking the following links:
Fig1. Fig2. Fig3. Fig4. Fig5a. Fig5b. Fig6. Fig7.
to PlanetWater |
 |
or | more research |
 |